- Industry Statistics
- Wedding Industry Statistics
- Yoga Industry Statistics
- Music Industry Statistics
- Landscaping Industry Statistics
- Bicycle Industry Statistics
- Coffee Industry Statistics
- Car Rental Industry Statistics
- Home Improvement Industry Statistics
- Insurance Industry Statistics
- Supplements Industry Statistics
- Golf Industry Statistics
- Fitness Industry Statistics
- US Media And Entertainment Industry Statistics
- Firearm Industry Statistics
- Financial Services Industry Statistics
- Health And Wellness Industry Statistics
- Trucking Industry Statistics
- Wine Industry Statistics
- Pet Industry Statistics
- Mobile App Industry Statistics
- Digital Marketing Industry Statistics
- Hotel Industry Statistics
- Retail Statistics
- Robotics Industry Statistics
- Jewelry Industry Statistics
- Appointment Scheduling statistics
- Restaurant Industry Statistics
- Food Delivery Statistics
- Food Truck Industry
- Fashion Industry
- Real Estate Industry
- US Film Industry
- US Beverage Industry
- USu202fFast Food Restaurants
- US Construction Industry
- US Book Industry
- Cosmetics Industry
- US Food Retail Industry
- US Pharmaceutical Industry
- US Healthcare Industry
- Airline Industry
- Automobile Industry
- Transportation Industry Statistics
- Event Industry Statistics
- Project Management Statistics
- Oil And Gas Industry Statistics
- Nursing Home Statistics
- Nursing Shortage Statistics
- Nursing Statistics
Restaurant industry research summary. The US restaurant industry attracts millions of patrons each year. It’s clear that Americans love going out to eat, but the food business is changing through the growth of restaurant technology and online ordering. Here are the key statistics on the ever-changing restaurant industry:
-
There are 749,404 restaurants in the United States, as of 2023.
-
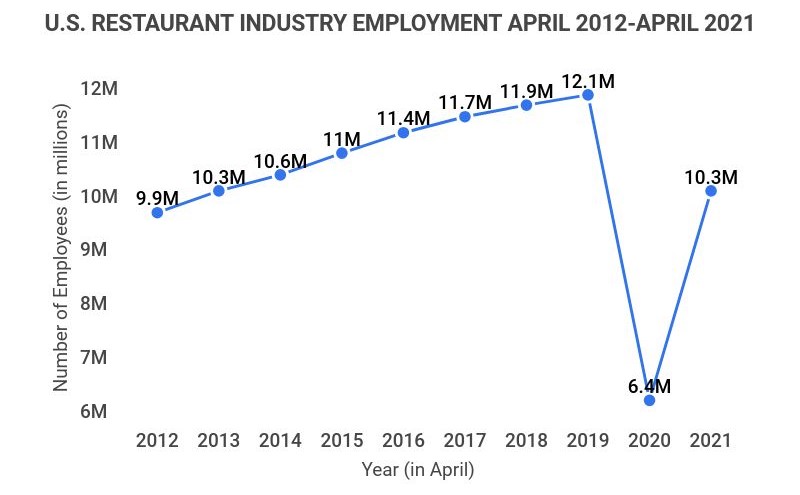
It is forecasted that there will be 15.5 million restaurant employees in the United States by the end of 2023.
-
9 out of 10 restaurants in the United States are small businesses with fewer than 50 employees.
-
7 out of 10 restaurants in the United States are single-unit operations.
-
94% of diners research a restaurant’s reviews online before going.
-
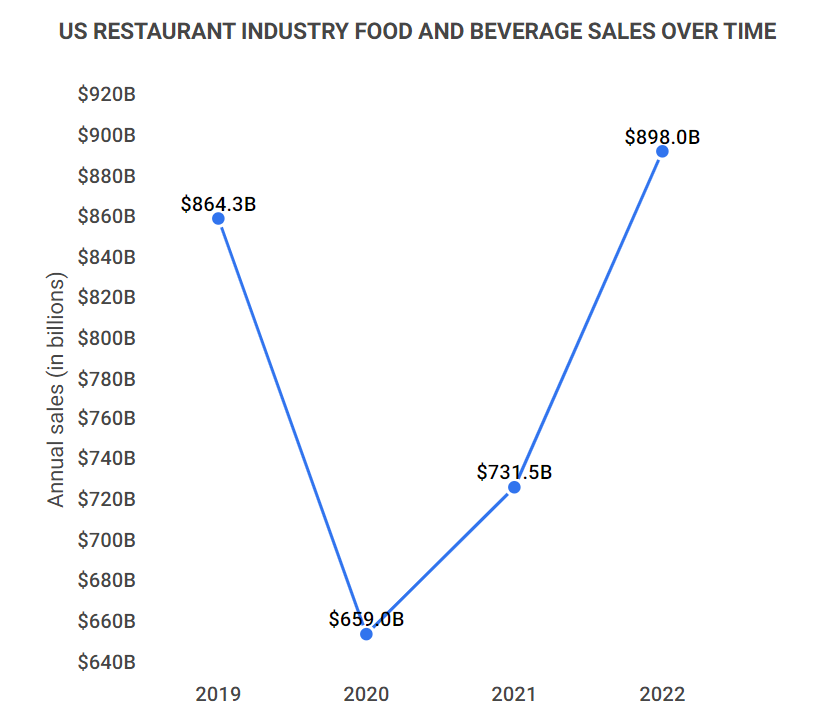
The US restaurant industry made $898 billion in sales over 2022, up $166.5 billion from 2021.
-
A total of 110,000 restaurant locations were closed temporarily or permanently over the pandemic in 2020.
-
Restaurant industry sales were $240 billion below pre-pandemic forecasts for the year in 2020.
For further analysis, we broke down the data in the following ways:
The Effects of the Pandemic | Restaurant Consumers | Customer Reviews | Employment | Restaurant Owners | Restaurant Technology | Online Ordering
General Restaurant Industry Statistics
The restaurant industry is one of the largest enterprises in the US, but has also faced many ups and downs. To dive deeper into some essential facts about the restaurant industry, we’ve gathered some interesting general statistics:
-
Restaurants account for 4% of the United States GDP as of 2020
-
There are 103,323 chain restaurants in the United States as of 2021
-
There are 490,000 independent restaurants in the United States as of December 2019
-
$997 billion is the 2023 sales forecast for total annual sales
-
90% of restaurants in the United States have under 50 employees
-
The average profit margin for a full-service restaurant is 3 to 5%, for a fast-casual restaurant is 6 to 9%, and for catering services is 7 to 8%
Restaurant industry sales 2019-2021
| Segment | 2019 Sales | 2020 Sales | 2021 Sales |
|---|---|---|---|
| Fullservice segment | $285B | $199.5B | $220.8B |
| Limited service segment | $308.9B | $290.4B | $313.6B |
| Bars and taverns | $22B | $7.7B | $13.9B |
| All other foodservice establishments | $248.4B | $161.5B | $183.2B |
| Total | $864.3B | $659B | $731.5B |
Restaurant industry statistics and the pandemic
The restaurant industry was devastated by the COVID-19 pandemic. Hundreds of thousands of restaurants were forced to close, and millions of restaurant employees lost their jobs. To find out more about the impact of the pandemic on restaurants around the US, here are some insights our research uncovered:
-
2.4 million restaurant employees lost jobs throughout the pandemic.
In the 2020 holiday season alone, 372,000 restaurant and bar workers lost their jobs. As such, workers from restaurant and bar establishments made up 74% of unemployment numbers from December 2020.
-
Restaurant sales dropped by $205.3 billion in 2020.
This represents a colossal percentage drop of 23.8% from the previous year.
-
10% of all restaurants in the United States have closed permanently since the pandemic began as of March 2021.
When the pandemic first began, 778,807 food establishments were operating in the United States. Since then, 79,438 of those restaurants have closed their doors for good.
Restaurant industry statistics by consumers
The restaurant industry is driven by its consumers. For example, if more consumers want breakfast options and easier take-out, the restaurant industry will often deliver. Here are some examples of how consumers impact the restaurant industry:
-
51% of Americans now use delivery services to purchase meals from restaurants.
While half of the United States uses food delivery services, 26% admit ordering takeout or getting delivery at least once a week.
-
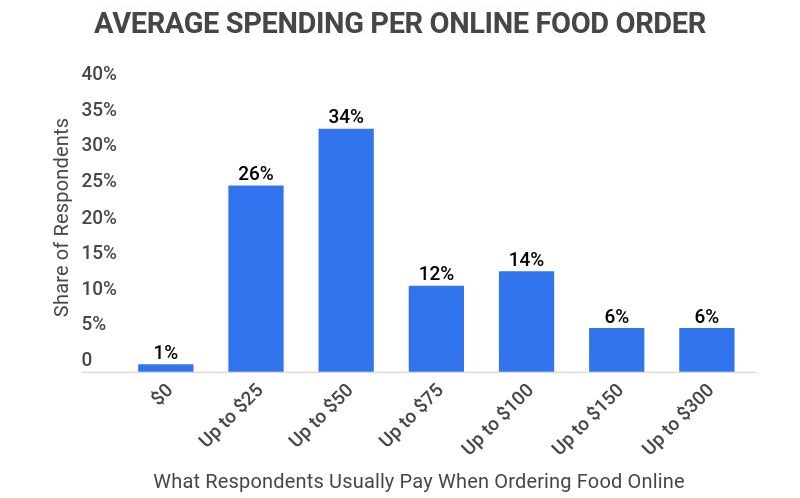
34% of consumers report spending an average of $50 when ordering food online.
In comparison, 26% reported their typical online food order as being up to $25, and 14% stated that they spent upwards of $100.
-
56% of 1,000 Americans responded that they typically ate out in a restaurant at least 2 to 3 times per week found in one study.
In this same study, 10% of participants said that they ate out 4 to 6 times a week, and 6% of people stated that they ate out for at least one meal every single day.
-
One survey-based study found that respondents who earned an annual salary of $40,000 to $50,000 per year spent the most money eating out at restaurants.
This particular earning group spent an average of $117.82 weekly, equating to 12.25 to 15.31% of their income.
-
The average American spends $2,994 per year on food away from home at restaurants, as of 2020.
This represents a decrease in spending by 12.8% from the previous year.
-
77% of consumers will visit a restaurant’s website before dining in or taking out food, according to one survey.
This same study found that 30% of diners are turned off by a menu that’s difficult to read, and 30% are turned off by a website that looks outdated.

Restaurant statistics by customer reviews
Restaurant success is also driven by consumer reviews. Critics and average customers will often rate the restaurants they visit, which any patron who comes after will notice. In that way, reviews play a vital role in whether or not customers are willing to give your restaurant a shot.
-
90% of visitors research a restaurant online before going.
As a whole, people demonstrate that they care about the quality of their experience at a restaurant immensely. The percentage of people who research an establishment before visiting is higher in the restaurant business than in any other type of industry.
-
33% of diners refuse to eat at a restaurant with less than four stars.
Reviews are dire for reaching future consumers. Around 92% of diners choose to read the reviews for a restaurant they plan to attend. For many people, if these reviews fall below a certain expectation, they write the entire location off and move on to finding somewhere else.
-
77% of consumers prefer reading reviews from other customers instead of professional critics.
While many people might think that the opinion of a professional critic would be more trusted, the average restaurant attendee wants to hear from other diners like them.
The busy salesperson who only has 25 minutes for lunch and stops in every Tuesday, the mother who routinely comes by for their favorite sandwich. These are the people whose opinions can be extremely valuable in the restaurant industry.
-
45% of diners in the United States state that they’ve tried a restaurant for the first time because of a social media post made by the establishment, as of 2019.
Alternatively, 13% of U.S. restaurant visitors say that an establishment’s social media posts have deterred them from returning to eat again.
-
Approximately 5 to 10% of consumers write reviews.
Though this sounds like a small percentage, these opinions are very important to other people around the globe. 84% of people trust these online reviews as much as they would trust a recommendation from a friend.
Restaurant statistics by employees
Restaurants wouldn’t be able to operate, whether they’re a massive franchise or a mom-and-pop shop, without hardworking employees. With that in mind, we’ve gathered some essential facts about the employees who work in the restaurant industry:
-
7.1% of the workforce in the United States work in the restaurant industry
-
In one survey about restaurant employee happiness, 50% of respondents stated that more training would positively impact their work satisfaction, and 70% of individuals who felt this way specifically wanted additional hands-on training from a manager
-
54.5%% of restaurant workers are women, and 45.5%% are men
-
The average age of a restaurant worker is 27 years
-
The typical annual salary of a restaurant employee is $25,504
-
90% of restaurant managers started in an entry-level position
Median hourly wage for foodservice workers
| Occupation | Median Hourly Wage |
|---|---|
| Foodservers, nonrestaurant | $12.46 |
| Dining room and cafeteria attendants and bartender helpers | $12.03 |
| Hosts and Hostesses, restaurant, lounge, and coffee shop | $11.48 |
| Fast food and counter workers | $11.47 |
Restaurant industry statistics by owners
Restaurants can be owned by a diverse range of people. However, whether you’re a CEO of a franchise or the owner of one small restaurant, you’ll face many challenges in the business.
-
The #1 challenge for restaurant owners is finding and maintaining quality staff.
Sourcing and keeping a staff of qualified and reliable individuals is an especially crucial task following the events of COVID. Some of the other top challenges that every restaurant owner must face include the rising cost of food, massive operational costs, and expanding their customer base.
-
The cost of replacing a single frontline restaurant employee is approximately $5,864 according to the Center for Hospitality Research at Cornell.
Of this amount, 20% is spent on recruiting, 14% on training and orientation once a suitable candidate is sourced, and 52% is represented by productivity loss.
-
A rating increase of one star on Yelp translates to a 5% to 9% average increase in revenue, according to one study.
This same study found that ratings mainly impacted independent restaurant businesses and that chain restaurants generally remained unscathed by reviews. It also found that the typical consumer responded to ratings more positively when presented with more information.

Restaurant industry statistics by technology
Restaurant food, service, and employment is always changing due to changes in technology. Digital ordering and automation have the potential to change the restaurant industry forever, and many new technologies already have.
-
75% of restaurants plan on offering contactless ordering and payment options, with 61% accepting contactless payments on their premises
-
As of 2021, 91% of restaurants use kitchen automation technology
-
Digital food ordering has increased 135% since June 2020
-
81% of diners have used a restaurant’s website to place an order online
-
According to one study, 65% of customers stated that they would visit a restaurant more often if there were self-service kiosks provided
-
79% of consumers agree that technology helps improve their restaurant experience
Restaurant statistics by online ordering
The COVID-19 pandemic sparked many new trends in the restaurant industry. One of these trends, which still remains popular in 2023, is online ordering. Check out these fascinating statistics:
-
Online food ordering is expected to grow to over $220 billion by 2025.
This would equate to roughly 40% of all restaurant sales.
-
46% of consumers expect restaurants to have online ordering.
When ordering food online, about 67% of diners said they would prefer to use a restaurant’s website or an app for food delivery.
-
Online ordering accounts for approximately 42% of the overall food ordering market.
While the growth rate of the food industry as a whole tends to grow by a steady 3.7%, the growth of online ordering has demonstrated an annual growth rate of 15% to 20%.
Restaurant industry statistics FAQ
-
Is the restaurant industry growing or shrinking?
Though it shrunk in 2020, the restaurant industry is currently growing back to what it once was. The restaurant industry has undoubtedly been hit hard by the COVID-19 pandemic – perhaps harder than any other type of business.
In 2020, restaurant sales dropped by 24%, or $205 billion. Additionally, 10% of all restaurants in the United States have closed their doors for good.
With this being said, the restaurant industry is growing in other ways. Restaurant technology and online ordering are becoming increasingly popular in recent years, especially under the influence of the pandemic.
By June of 2020, the presence of digital ordering had already increased by 135%. By 2025, the value of online food ordering is expected to grow to over $220 billion.
While COVID-19 has damaged the in-person restaurant industry, other facets of the business, like online ordering, have flourished.
-
What is the restaurant industry forecast for 2022?
The restaurant industry forecast for 2022 is that technology, digital ordering, and delivery will become even more prevalent.
79% of diners agree that technology helps improve their restaurant experience, which businesses in the industry value more in an age when in-person dining is at an all-time low.
Before the pandemic, digital ordering only accounted for 10% of all orders. Since then, online orders have accounted for 28%. This trend is predicted to continue into 2022.
-
What percentage of the United States economy is accounted for by the restaurant industry?
The restaurant industry accounts for 4% of the United States economy. The fact is that the restaurant industry is the second largest private employer in the US, where 1 in 10 US workers work. That makes it a huge contributor to the nation’s economy.
-
How many people have left the restaurant industry since 2020?
2.4 million restaurant employees have lost their jobs and left the restaurant industry since the pandemic began in 2020. And even as of 2021, up to 2 million of those workers were still out of a job.
-
What are the two major segments of the foodservice industry?
The two major segments of the foodservice industry are commercial and noncommercial. The commercial segment includes restaurants, hotels, food delivery, personal/business catering, and things like cafeterias and food courts. Noncommercial foodservice includes hospitals, military stations, prisons, colleges, and institutional/industrial catering.
Roughly 80% of the foodservice industry is comprised of the commercial segment, while 20% is noncommercial.
-
Is a restaurant a hard business to run?
Yes, a restaurant is a hard business to run. 60% of restaurants don’t stay open past their first year in business, and by year four, 80% of new restaurants have closed.
While the pandemic highlighted the extreme precariousness of the restaurant industry, it did not create it. Restaurants have always had a fairly high business turnover rate compared to other industries.
Conclusion
The restaurant industry has always been massive whether you’re looking at the 15.5 million people it employs, its over $650 billion valuation, or the nearly 600,000 dining establishments in the United States.
Restaurants account for 4% of the overall GDP in the United States, a larger percentage than the automobile industry at 3% and the fashion industry at 2%.
People have spent centuries enjoying a meal out at a restaurant. According to one study, it’s considered such a pleasurable activity that over half of people stated that they go out to eat a minimum of two to three times per week.
Through all the trials and tribulations of American history, restaurants have greatly endured. However, this track record hit a roadblock in 2020 with the onset of the COVID-19 pandemic.
While individuals and businesses alike all suffered from the implications of COVID-19, the restaurant industry and its employees were significantly wounded.
Since 2020, 2.4 million loyal restaurant employees have lost their jobs in just the United States. The industry has experienced the permanent closure of 10% of its restaurants. Additionally, restaurant sales were $240 billion less than expected in 2020.
While the past few years have been extraordinarily difficult for restaurants, there is still hope for the future. The restaurant experience is changing in the face of new technology and the limitations laid out by the pandemic.
Social media, online ordering, and even self-ordering kiosks devices have enabled a new way for customers to interact with their favorite dining establishments. Since June of 2020, the use of digital food ordering has increased by an incredible 135%.
Today, online ordering accounts for 42% of all food orders, and 79% of consumers agree that technology improves their restaurant experience. By 2025, the online food ordering market will grow to $220 billion. This illustrates that there is a potential for future growth within the restaurant industry, though it may involve a lot of changes.
References
-
Trip Advisor. “Influences on Diner Decision-Making.” Accessed on November 27, 2021
-
National Restaurant Association. “State of the Restaurant Industry 2021”. Accessed on November 27, 2021
-
Forbes. “As Restaurants Go, So Goes The Economy.” Accessed on November 27, 2021
-
CHD Expert. “U.S. Independent Restaurant Landscape.” Accessed on November 27, 2021
-
Ibis World. “Chain Restaurants in the US – Number of Businesses 2002–2027”. Accessed on November 27, 2021
-
Restaurant365. “What is the Average Profit Margin for a Restaurant?”. Accessed on November 27, 2021
-
Business Insider. “Restaurant job losses surged to 372,000 over the holidays in largest employment decline since April”. Accessed on November 27, 2021
-
Cision. “Datassential: 10% of all U.S. restaurants have closed permanently since the pandemic began”. Accessed on November 27, 2021
-
Statistica. “What do you usually pay per order when ordering food online?”. Accessed on November 27, 2021
-
Nation’s Restaurant News. “Restaurant takeout and delivery are taking a bite out of dine-in traffic.” Accessed on November 27, 2021
-
Yahoo! Finance. “People Who Eat Out Usually Eat Out a Lot: Survey.” Accessed on November 27, 2021
-
Business Wire. “Fourth Unveils First Annual “Truth about Dining Out” Survey Results, Revealing Americans’ Eating-out Habits, the Rise of Third-Party Delivery Apps and Favorite Celebrity Chef.” Accessed on November 27, 2021
-
BLS. “CONSUMER EXPENDITURES MIDYEAR UPDATE – JULY 2019 THROUGH JUNE 2020 AVERAGE”. Accessed on November 27, 2021
-
MGH. “Why a restaurant’s website can help make (or break) its sales.”. Accessed on November 27, 2021
-
Upserve. “Digital Marketing for Restaurants: How to Get Found Online.” Accessed on November 27, 2021
-
QSR. “Study: Nearly 50 Percent of Diners Influenced by Social Media”. Accessed on November 27, 2021
-
Website Builder. “26 Mind-Boggling Online Review Statistics Facts for 2021”. Accessed on November 27, 2021
-
7Shifts. “[Study] Is Workplace Happiness All About Pay? What 1,900+ Restaurant Staff Think”. Accessed on November 27, 2021
-
Zippia. “RESTAURANT WORKER Demographics And Statistics In The US.” Accessed on November 27, 2021
-
Upserve. “Explore the Career Path Opportunities of a Restaurant Manager.” Accessed on November 27, 2021
-
Grubhub. “How to overcome the 4 biggest challenges all restaurant owners face”. Accessed on November 27, 2021
-
Modern Restaurant Management. “What is the Real Cost of Restaurant Employee Turnover?”. Accessed on November 27, 2021
-
Harvard Business School. “Reviews, Reputation, and Revenue: The Case of Yelp.com.”
-
Square. “The Future of Restaurants.” Accessed on November 27, 2021
-
Technomic. “Technomic’s Take: COVID-19, The Foodservice View”. Accessed on November 27, 2021
-
Hospitality Technology. “4 Steps for Maintaining the Art of Customer Service in the Takeout Age”. Accessed on November 27, 2021
-
Foodtec. “65% of Customers Prefer Self-Service Kiosks: Is Your Restaurant Ready?”. Accessed on November 27, 2021
-
Toast Tab. “Restaurant Technology in 2017”. Accessed on November 27, 2021
-
Hospitality Technology. “79% of Diners Say Technology Improves Their Restaurant Experience”. Accessed on November 27, 2021
-
Lavu. “The Growth of Online Ordering and Food Delivery.” Accessed on November 27, 2021
-
Forbes. “Restaurant Industry Outlook For 2022: Five Trends To Watch”. Accessed on November 27, 2021
-
Wonder. “On average, how many online orders does an independent restaurant receive per day or per week or per month, in the US?”. Accessed on November 27, 2021
-
BLS. “Food Services and Drinking Places: NAICS 722”. Accessed on March 6,2023
-
National Restaurant Association. “Restaurant Industry Facts at a Glance.” Accessed on March 6, 2023
- Industry Statistics
- Wedding Industry Statistics
- Yoga Industry Statistics
- Music Industry Statistics
- Landscaping Industry Statistics
- Bicycle Industry Statistics
- Coffee Industry Statistics
- Car Rental Industry Statistics
- Home Improvement Industry Statistics
- Insurance Industry Statistics
- Supplements Industry Statistics
- Golf Industry Statistics
- Fitness Industry Statistics
- US Media And Entertainment Industry Statistics
- Firearm Industry Statistics
- Financial Services Industry Statistics
- Health And Wellness Industry Statistics
- Trucking Industry Statistics
- Wine Industry Statistics
- Pet Industry Statistics
- Mobile App Industry Statistics
- Digital Marketing Industry Statistics
- Hotel Industry Statistics
- Retail Statistics
- Robotics Industry Statistics
- Jewelry Industry Statistics
- Appointment Scheduling statistics
- Restaurant Industry Statistics
- Food Delivery Statistics
- Food Truck Industry
- Fashion Industry
- Real Estate Industry
- US Film Industry
- US Beverage Industry
- USu202fFast Food Restaurants
- US Construction Industry
- US Book Industry
- Cosmetics Industry
- US Food Retail Industry
- US Pharmaceutical Industry
- US Healthcare Industry
- Airline Industry
- Automobile Industry
- Transportation Industry Statistics
- Event Industry Statistics
- Project Management Statistics
- Oil And Gas Industry Statistics
- Nursing Home Statistics
- Nursing Shortage Statistics
- Nursing Statistics
Author
Sky Ariella is a professional freelance writer, originally from New York. She has been featured on websites and online magazines covering topics in career, travel, and lifestyle. She received her BA in psychology from Hunter College.